A/B Comparison
An A/B comparison puts two runs next to each other and shows what changed between them: a new build against the last one that passed, a branch against main, or a single test that behaves differently in two batches.
A/B comparisons work at two levels. Comparing two test batches tells you how a build performed overall. Comparing two tests — the same experience run in two different batches — tells you what happened inside a single scenario.
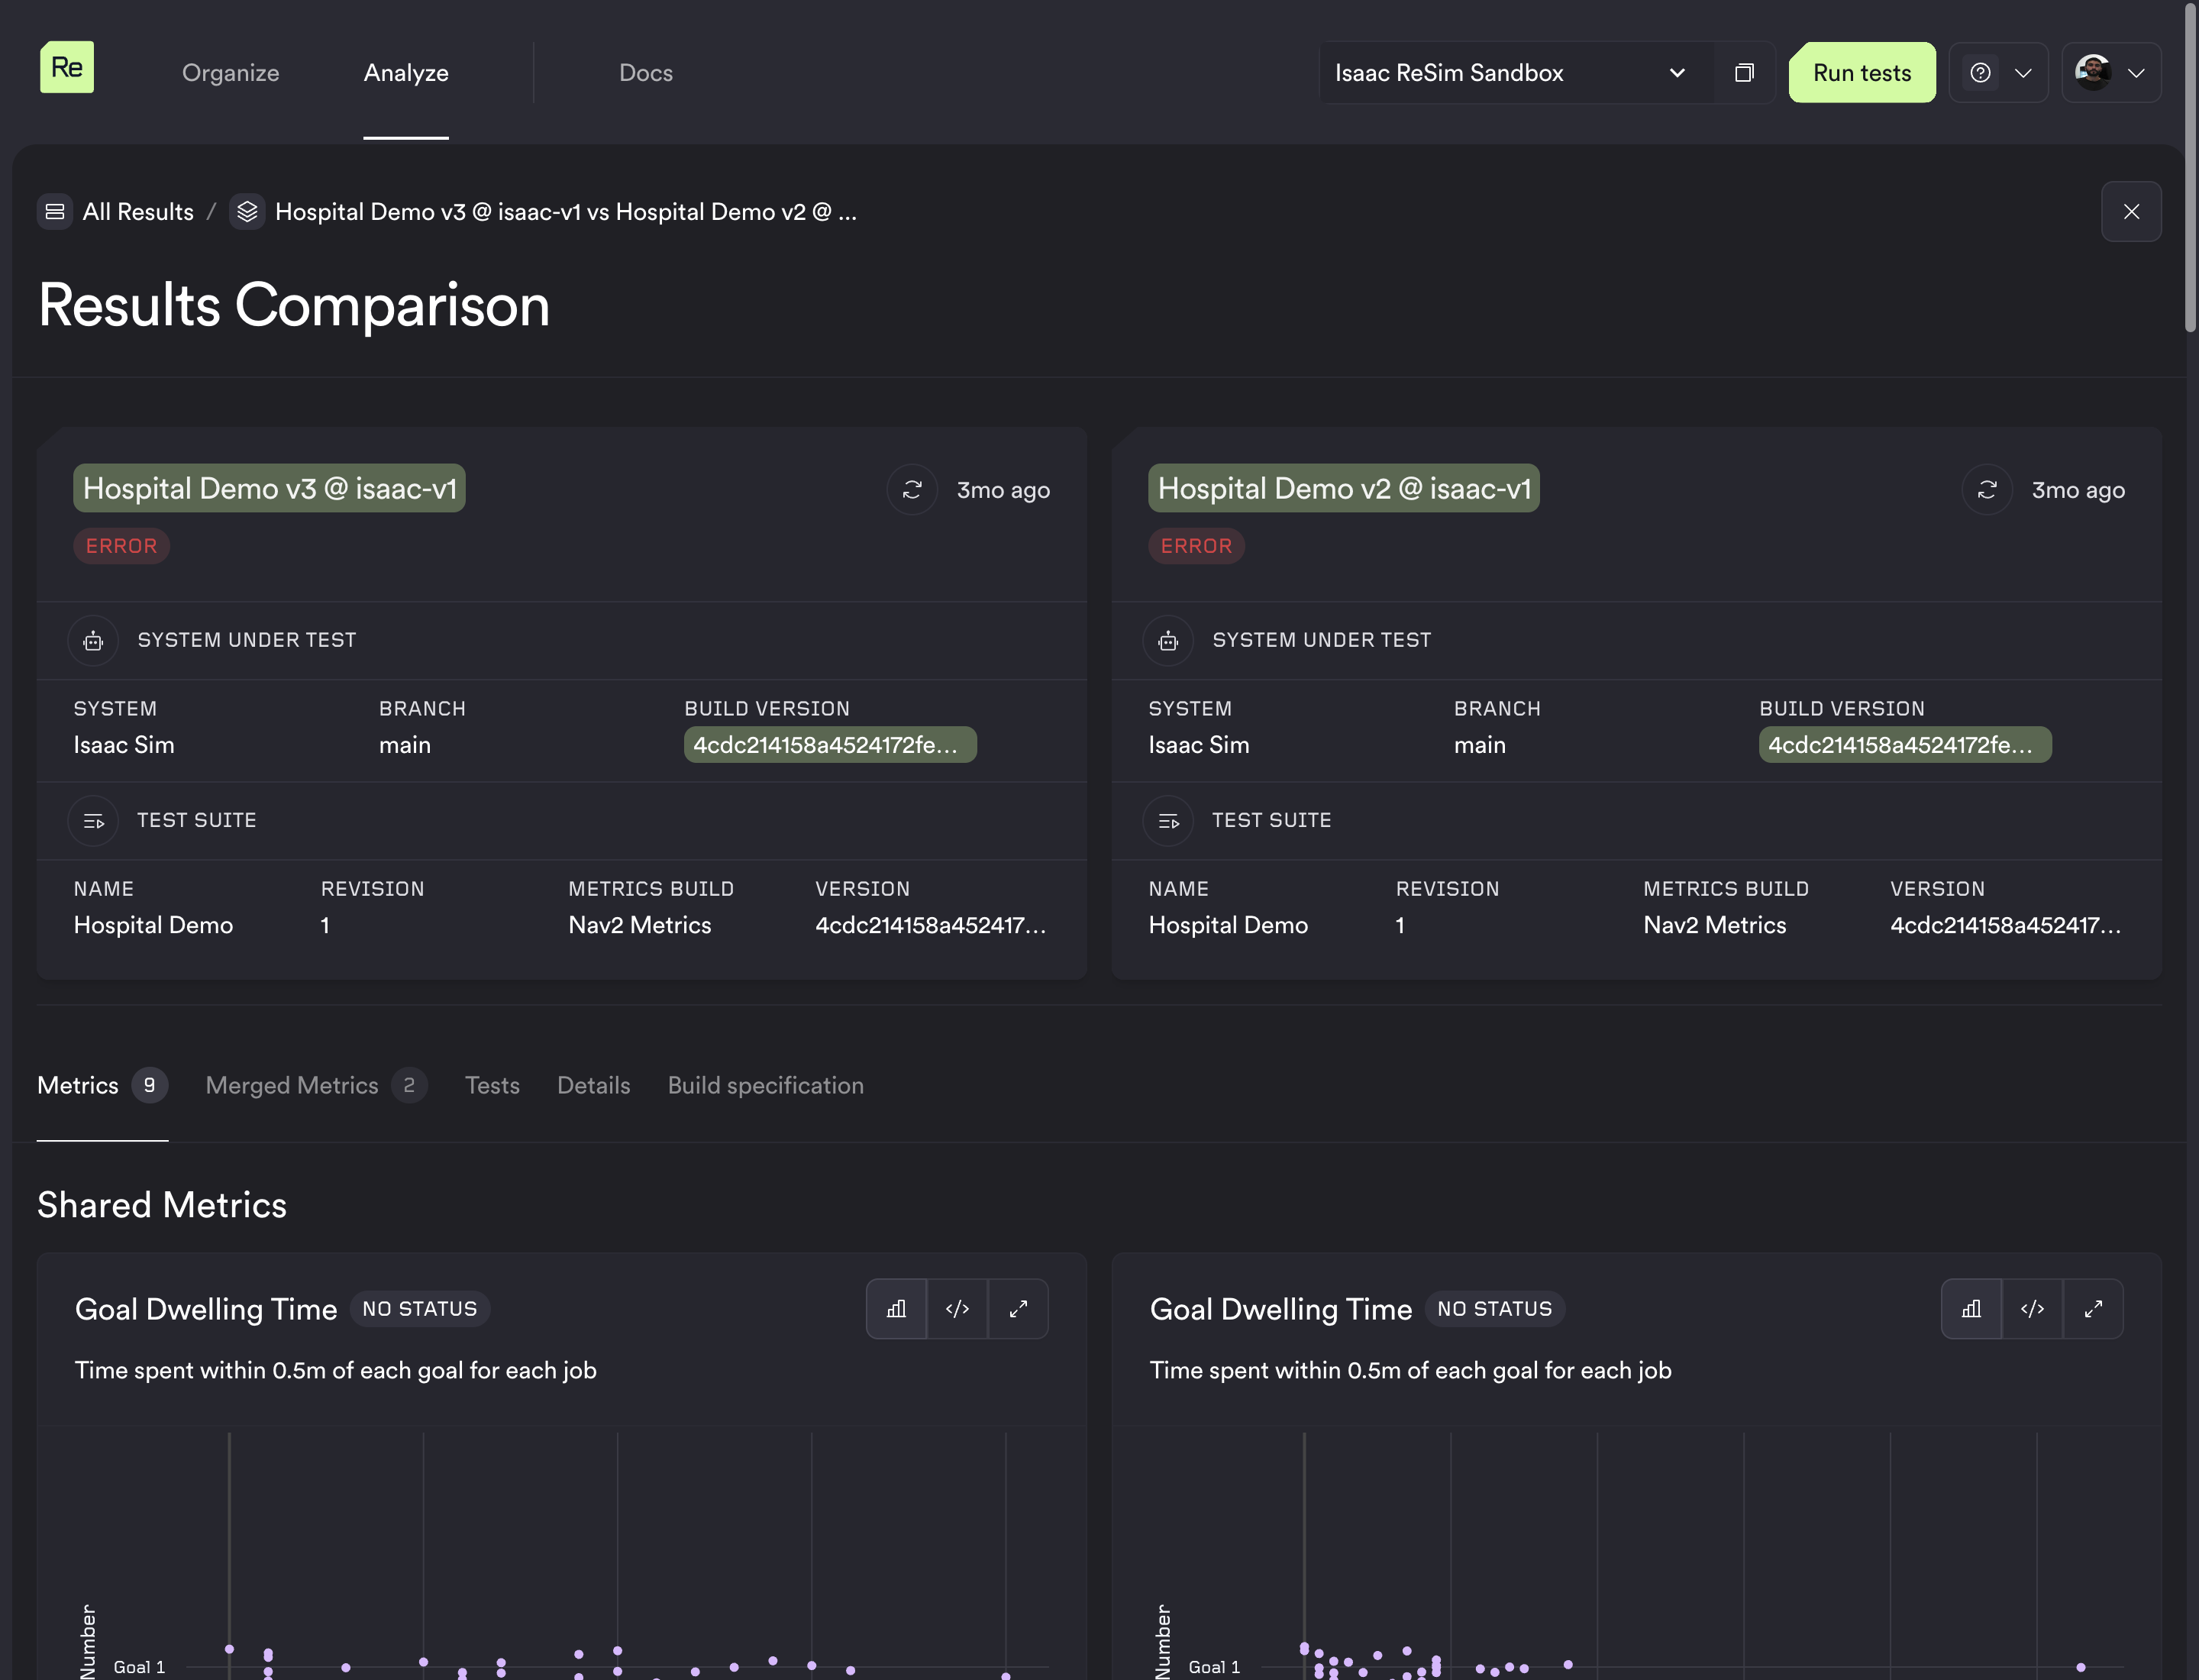
What the comparison shows
Both runs are summarized in a pair of cards at the top of the page, grouped into System Under Test (System, Branch, Build Version) and Test Suite (Name, Revision, Metrics Build, Version). Any field whose value differs between the two sides is highlighted. Long values such as build versions are truncated, so it is the highlight rather than the value that tells you the two runs differ.
Metrics: shared and unique
Metrics are matched between the two runs by name. Metrics present on both sides are paired under Shared Metrics, so the same chart from each run sits at the same place on the page. Everything else appears under Unique Metrics, in the column of the run that produced it.
Because the match is by name, renaming a metric splits the pair into two different entries, and the side-by-side reading of that metric is lost. Stable metric names keep comparisons useful over time.
Merged Metrics
Merged Metrics goes a step further and overlays a shared pair onto a single plot, so both runs are drawn on the same axes, and the difference between them is a distance on the chart rather than something you reconstruct across two images.
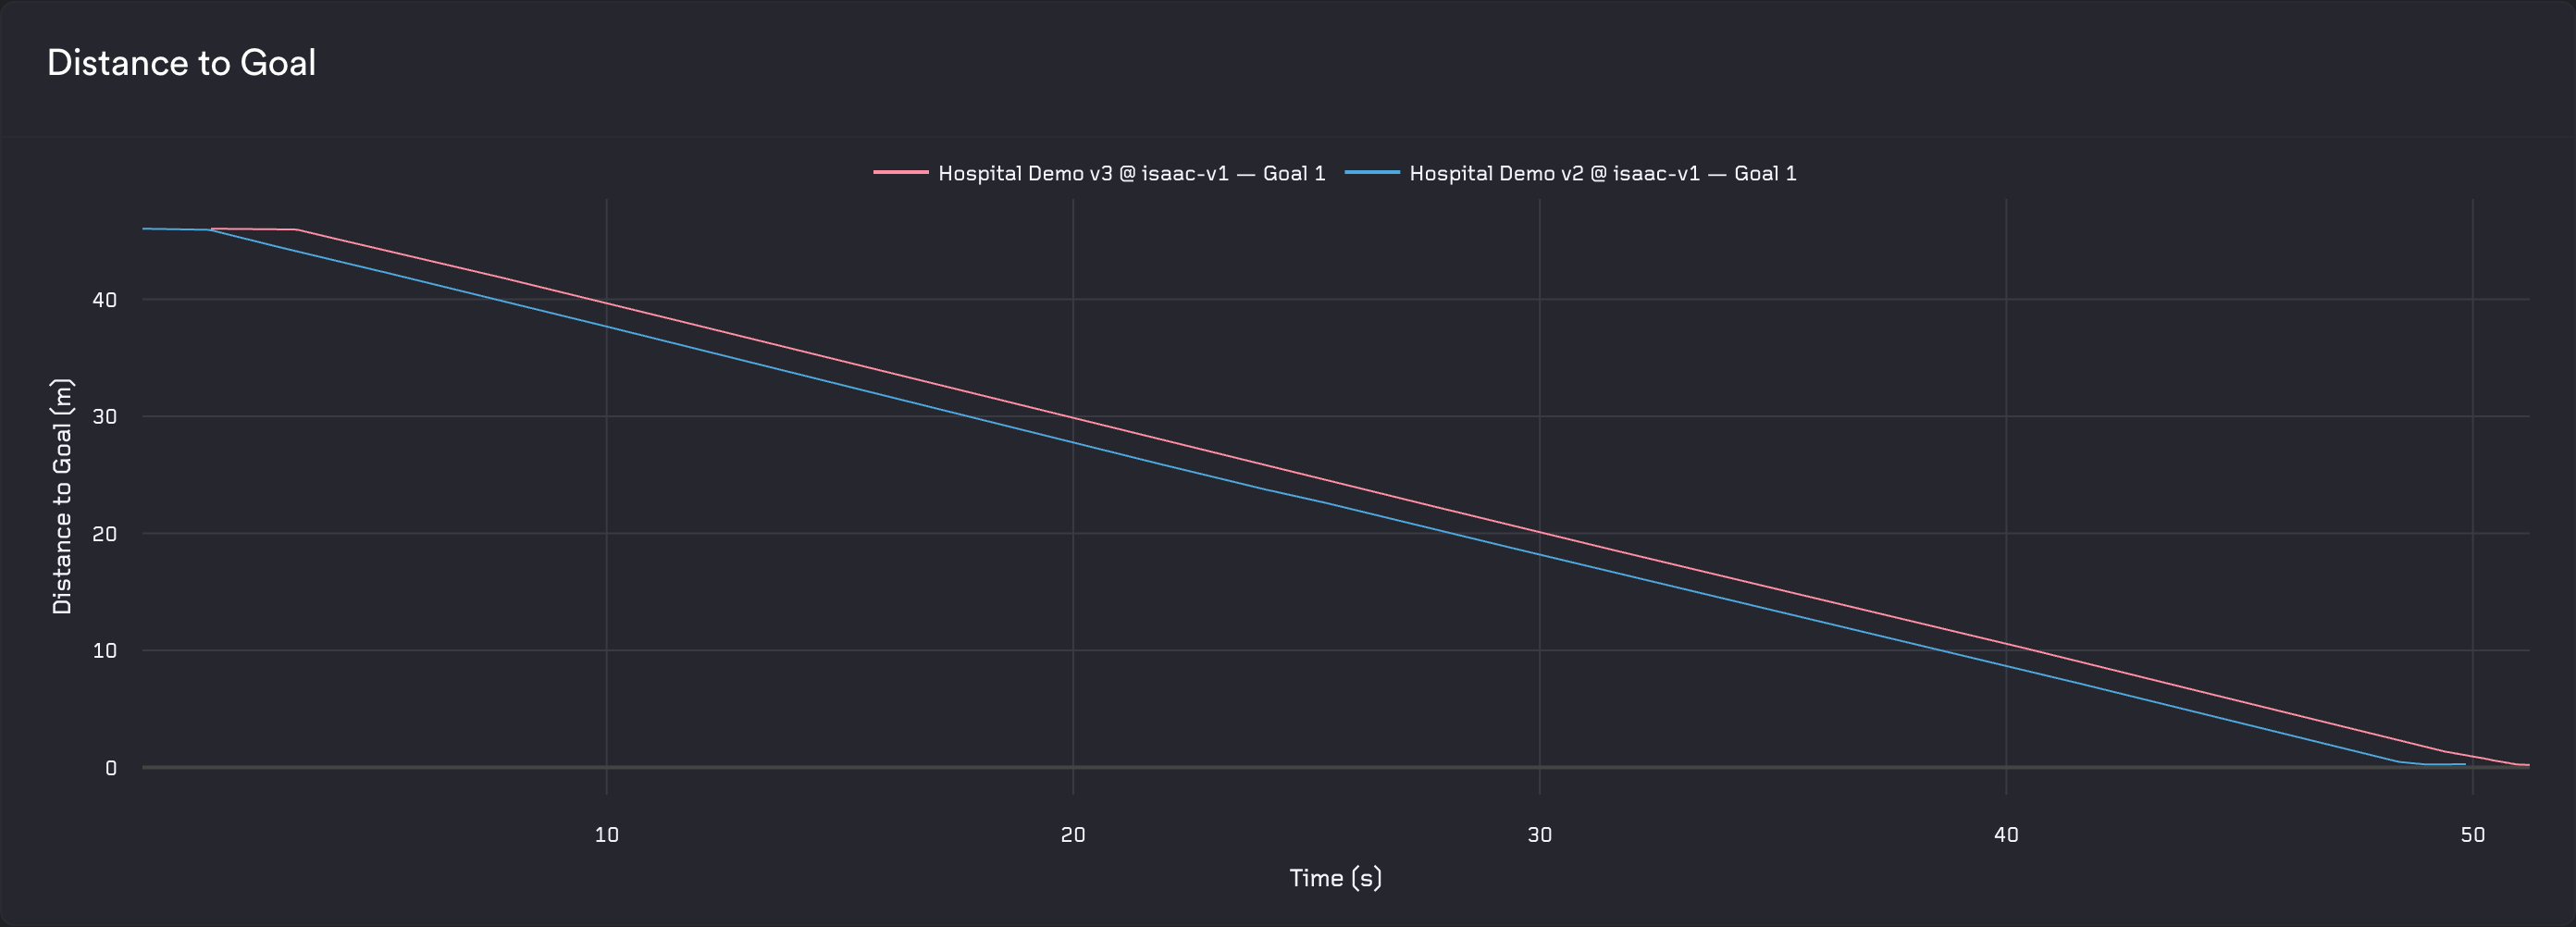
Not every shared pair can be overlaid. A pair qualifies when both sides are of the same chart type and that type has a meaningful overlay. A line chart cannot be drawn onto a bar chart, and scalars, images, videos, tables and state timelines have no sensible overlaid form, so those pairs are left out.
Comparing test outcomes
When you compare two batches, the Tests tab holds Test Performance Comparison: every experience that ran in both batches, with its status on each side, under the branch and build version of the run it belongs to.
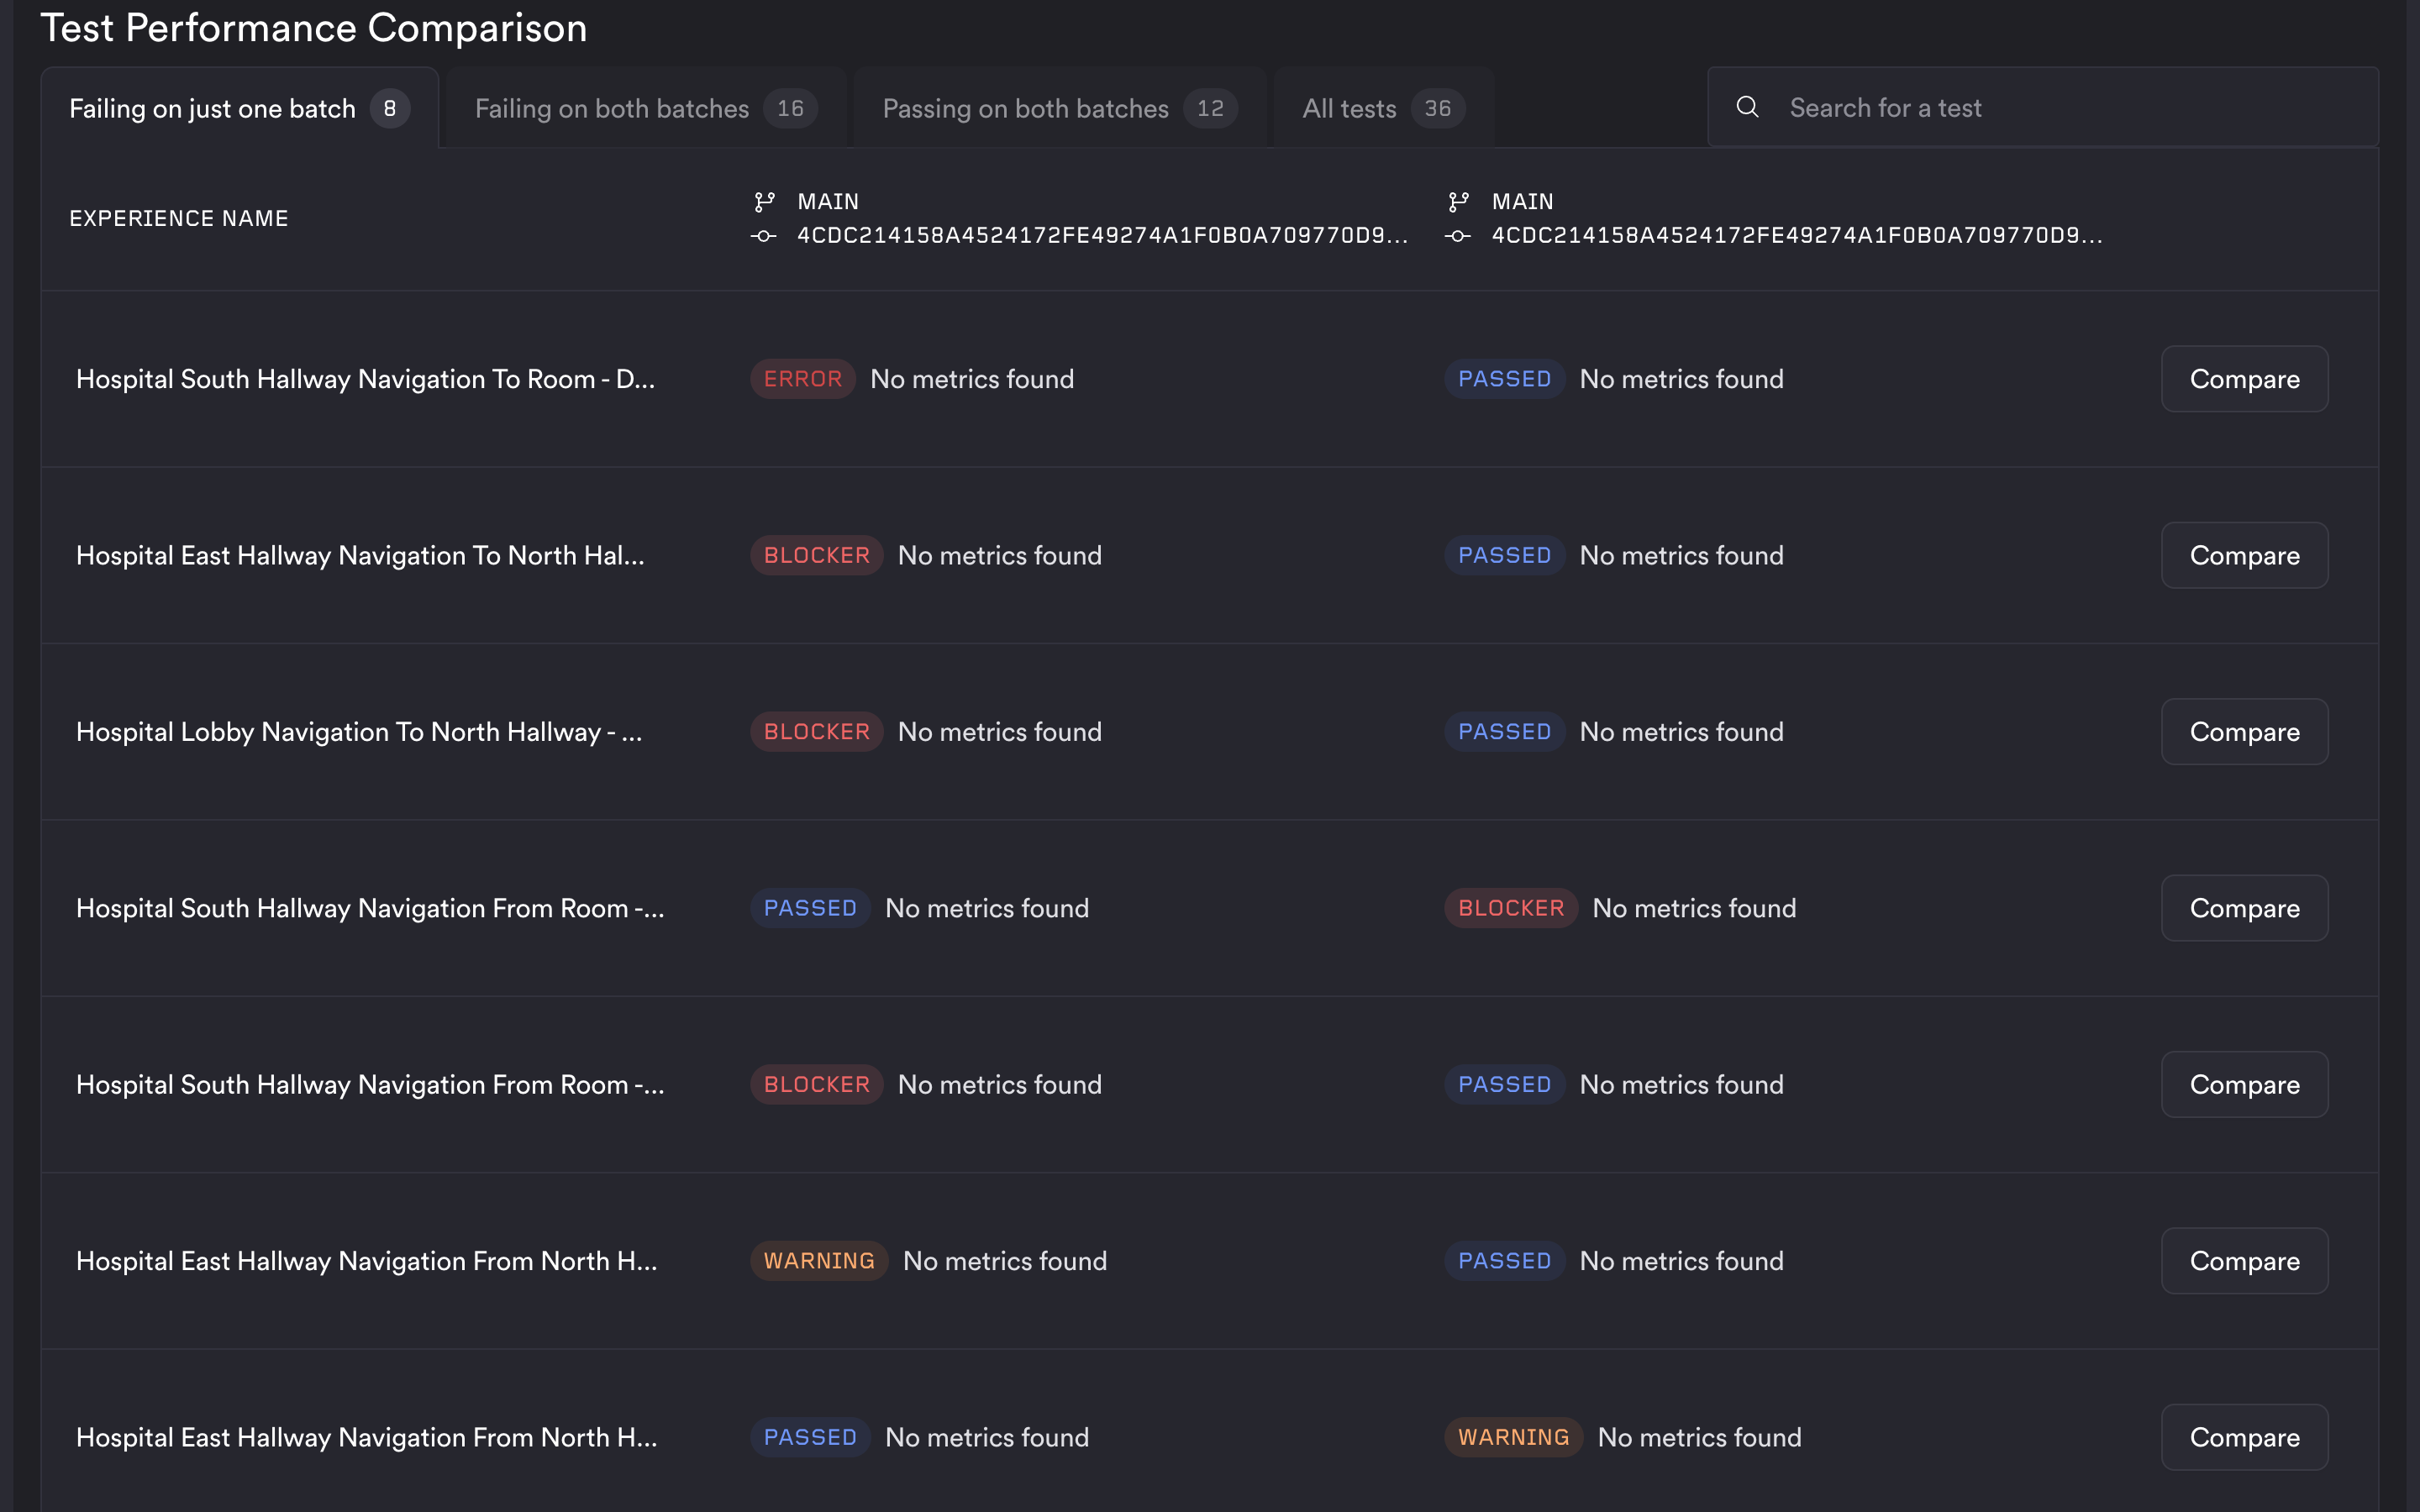
The tests are split into four groups:
- Failing on just one batch — the tests whose outcome actually changed. In a comparison against the last passing build, this is the regression and fix list, and it is normally the fastest read on a new build.
- Failing on both batches — pre-existing failures, which is what you check to confirm that a change did not fix what it was meant to fix.
- Passing on both batches — the stable set.
- All tests — every experience present in both batches.
Each row has its own Compare action, which opens the test-level comparison for that experience. That takes you from "this test regressed" to the two runs' metrics side by side without going back through the batch list.