Metrics 2.0 - Getting Started
Introduction
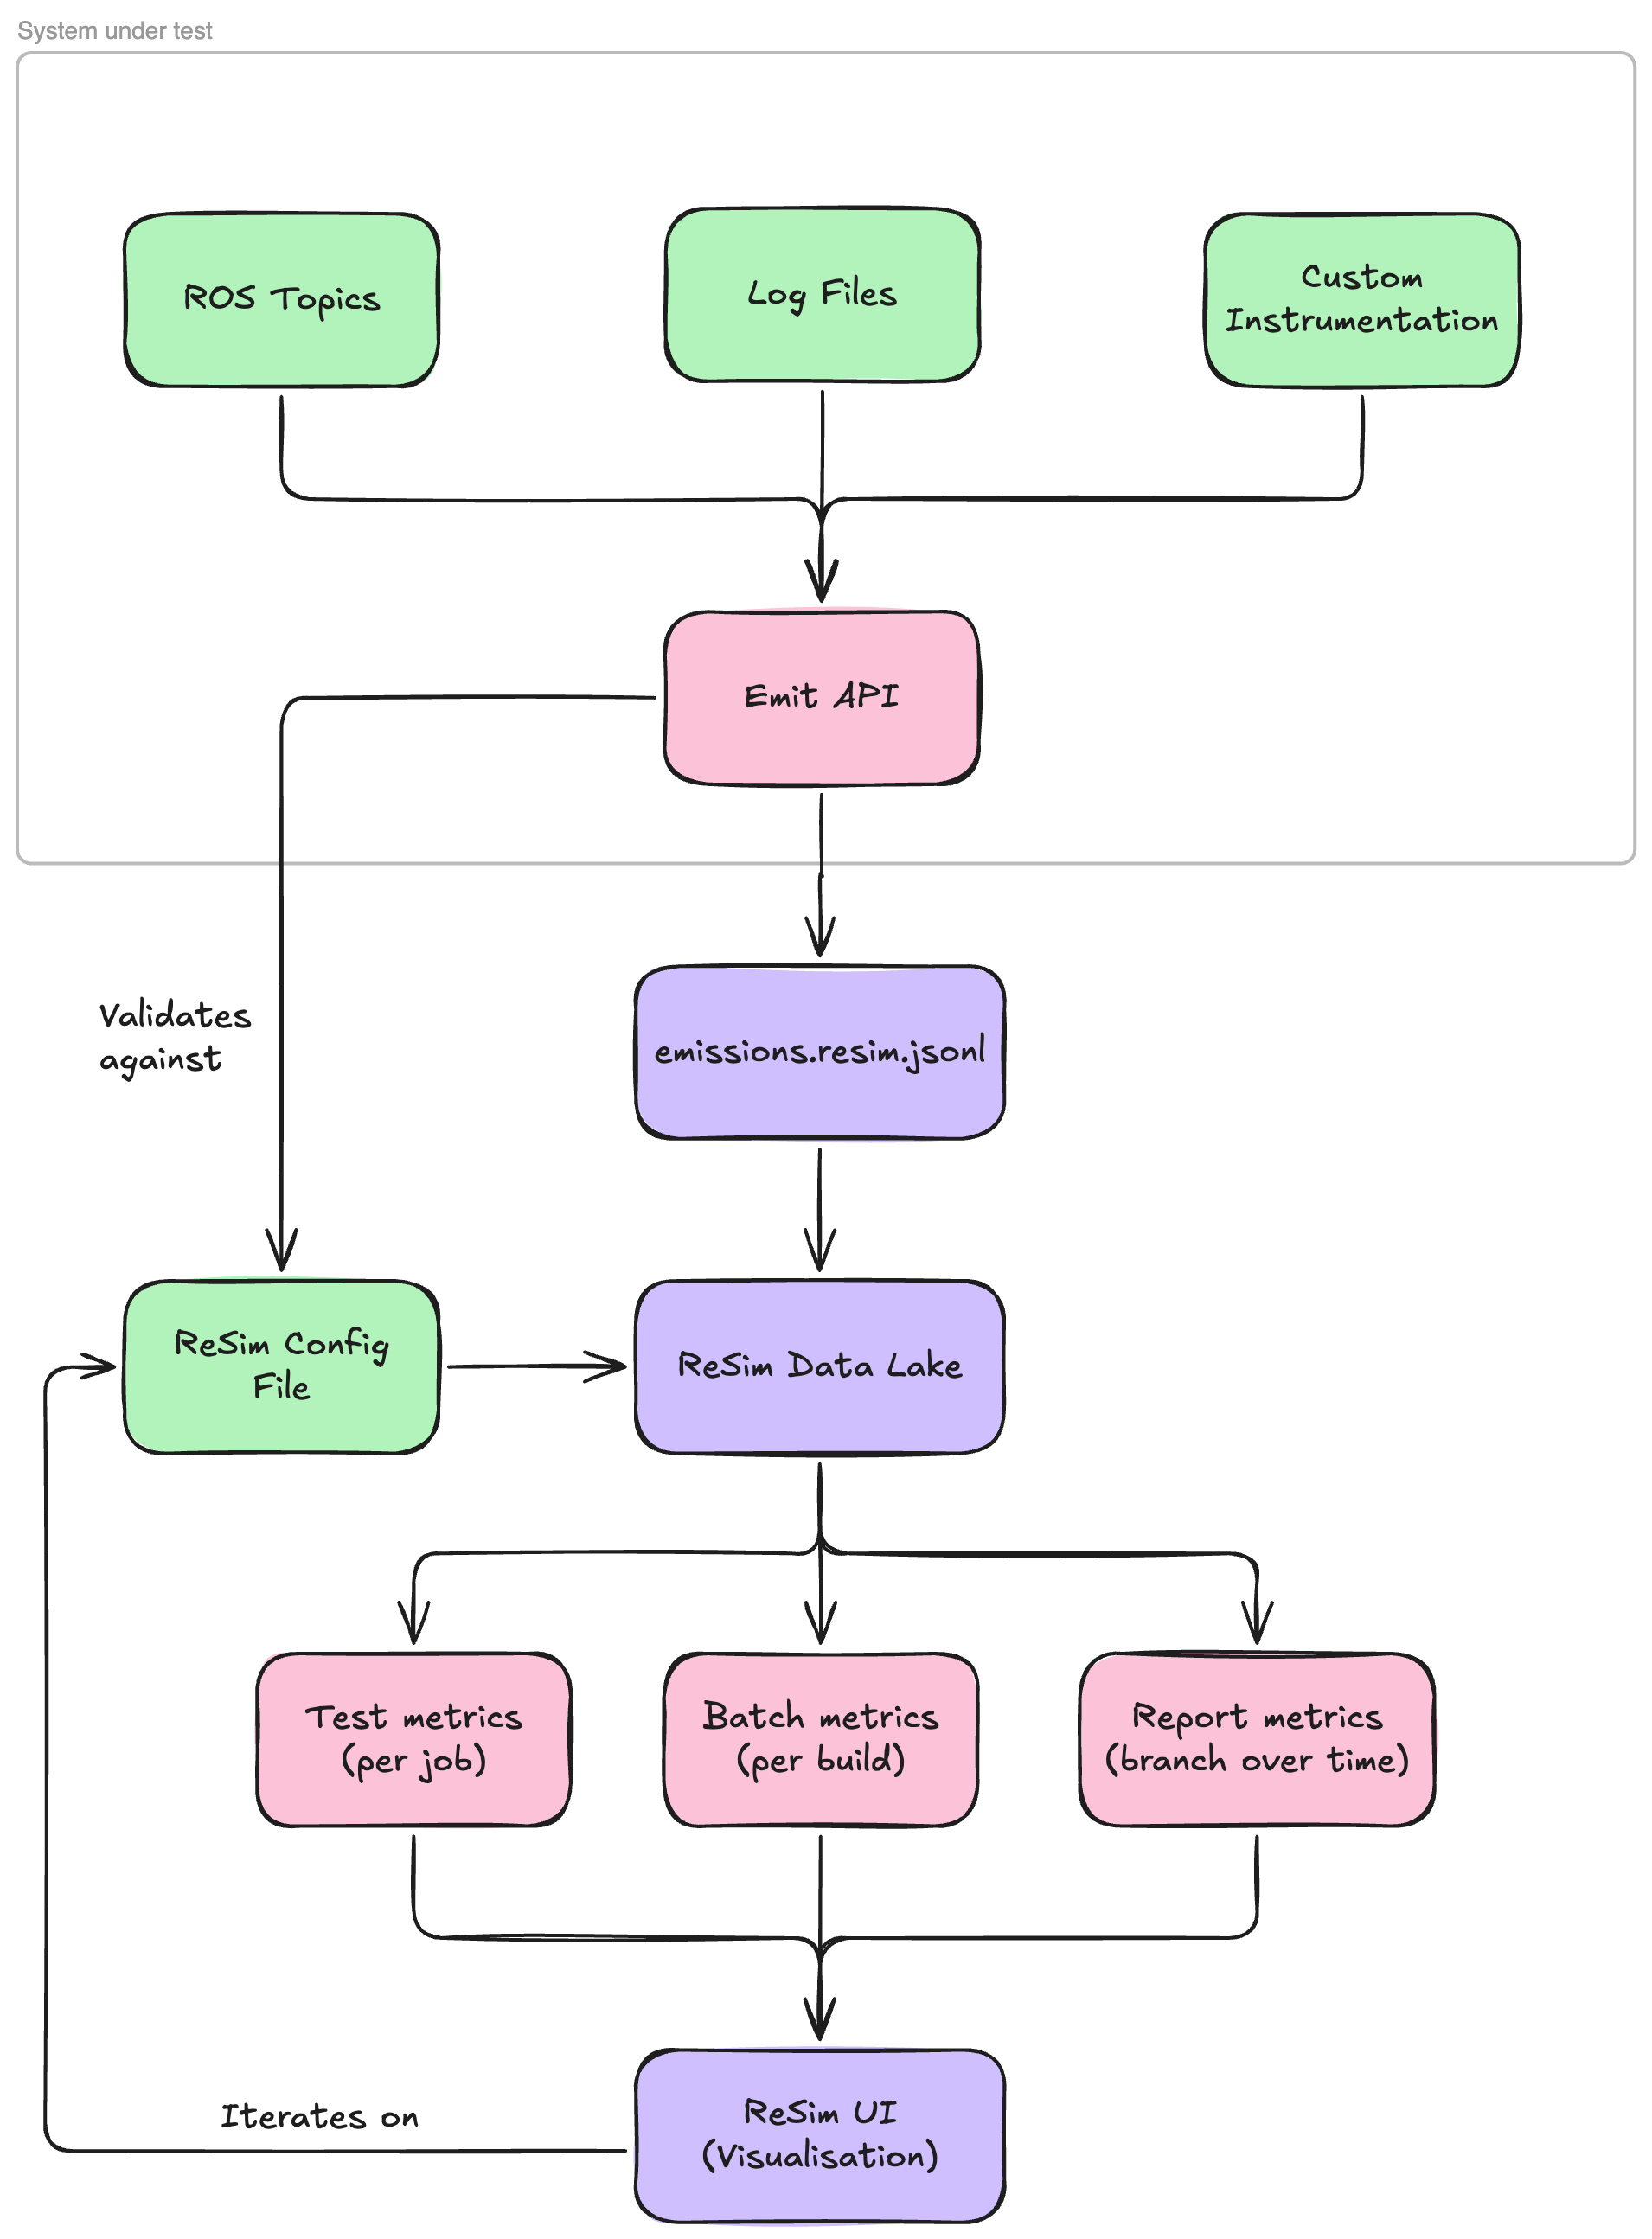
Metrics 2.0 is a major update to the Metrics framework that provides a more flexible and powerful way to collect, plot, and track data in ReSim. At its core, Metrics 2.0 works by ingesting data from various sources in your system; ROS topics, log files, or custom instrumentation, into a centralized data lake. When you emit data during a test run, it's automatically captured and stored in this data lake. After each run completes, the system automatically queries this data lake using SQL queries you've defined to generate metrics, visualizations, and pass/fail status checks. The data lake persists over time, which means you can continue to explore, query, and visualize your test data long after the run has finished, enabling powerful post-hoc analysis and trend tracking across releases.
Why use Metrics 2.0?
The data lake architecture provides several key benefits. Because your data persists, you're not limited to viewing only the metrics you defined before the test ran. You can return to the ReSim UI days, weeks, or months later to explore the raw data, write new queries, create new visualizations, and answer questions you didn't anticipate when you first ran the test. This makes Metrics 2.0 ideal for debugging unexpected failures, conducting retrospective analysis, and iterating on your metrics definitions without needing to re-run expensive tests.
Branch isolation
Metrics configurations are tied to specific branches in your project. This means your main branch can maintain a stable, well-tested set of metrics and data schemas, while development branches can experiment with new metrics, modify schemas, or test breaking changes without affecting production workflows. Each branch maintains its own independent metrics configuration, allowing engineers to iterate safely and merge changes only when they're ready.
What you'll create
To use Metrics, you'll create a single configuration file (.resim/metrics/config.resim.yaml) that defines three key components:
-
Topics — The schema for data you'll emit from your system (e.g., robot velocity, localization error, goal status). Topics define the structure and types of the data flowing into the data lake.
-
Metrics — SQL queries that transform your emitted data into visualizations and scalar values. Metrics can be test-level (computed per individual test run) or batch-level (aggregated across multiple test runs). Metrics can have status checks - optional thresholds attached to metrics that determine pass/fail/warning states. These allow you to automatically flag tests that miss performance requirements.
-
Metrics sets — Collections of metrics that are run against a set of tests, helping you to validate performance and learn about robot behavior.
The rest of this guide will walk you through each of these components step by step, starting with identifying the data you want to collect.
Identifying Key Data
The first step to adopting ReSim’s Metrics framework is to identify the key data that you want to collect, plot, and track over time in the ReSim Platform. To start with, we’d recommend simple data that you’re interested in plotting simply; i.e. your robot’s velocity over time. Identify where this data comes from; in our example, we’ll be reading it from our robot’s /odom topic.
Writing the schema
Firstly, we strongly recommend installing the ReSim VSCode Extension (or from Open VSX Registry for VSCode forks); it provides language support for ReSim config files and will help you avoid mistakes when emitting your data!
Look at the structure of the data you want to emit to ReSim; in our example case, we’re looking at the Odometry.twist.twist.linear data, which is a Vector3 representing the velocity of the robot in the x, y and z axis. We can write a ReSim config for this like so:
# required version header
version: 1

topics:
  odom_linear_velocity:
    schema:
      x: float
      y: float
      z: float
To ease your experience with writing queries, we recommend flattening nested data structures into their own topics. Additionally, we don’t support slash characters / in topic names (sorry!). Use the content assist from the VSCode extension to explore the available data types. In-depth descriptions are provided by the extension on hover.
The config file should be saved to .resim/metrics/config.resim.yaml in your repository. You’re also welcome to save it to another path - when using the ReSim CLI to start a batch, simply pass --metrics-config-path=<YOUR_PATH> as an option. The extension will only recognise files with the .resim.yaml suffix, so follow that pattern.
emit ting your data
There are two approaches to take here; you can either emit the data live from your stack or post-hoc when your test is complete. We’ll discuss both here.
The emit API is primarily used through the Emitter class. You can pass it a config_path and an output_path . output_path is where we will write your emissions file - by default it is
/tmp/resim/outputs/emissions.resim.jsonl . When config_path is both specified and is visible to the application, we will validate the types & shape of the data being emitted to ensure it will be ingested by the ReSim platform correctly. See below for an example:
from resim.metrics.python.emissions import Emitter

emitter = new Emitter(config_path=".resim/metrics/config.resim.yaml")
emitter.emit("odom_linear_velocity", {"x": 1.0, "y": 2.0, "z": 3.0}, timestamp=0)
emitter.emit("odom_linear_velocity", {"x": 1.1, "y": 1.9, "z": 0.0}, timestamp=500000000)
# rejected
emitter.emit("odom_linear_velocity", {"x": "left", "y": "right", "z": "up"}, timestamp=1000000000)
Under the hood, we append these messages to your output_path. In this example, the lines would look like this:
{"$metadata": {"topic": "odom_linear_velocity", "timestamp": 0}, "$data": {"x": 1.0, "y": 2.0, "z": 3.0}}
{"$metadata": {"topic": "odom_linear_velocity", "timestamp": 500000000}, "$data": {"x": 1.1, "y": 1.9, "z": 0.0}}
...
Stack Emissions
Here’s a more fully fleshed-out code example of a stack-based emission pattern. Continuing with our ROS example, we will create a new node for our stack, the MetricsEmitter which will receive messages from the /odom ROS topic and emit them to the odom_linear_velocity ReSim topic.
from rclpy.node import Node
from resim.metrics.python.emissions import Emitter
from nav_msgs.msg import Odometry
from builtin_interfaces.msg import Time as MsgTime
from rclpy.time import Time
from typing import Optional

class MetricsEmitter(Node):
    def __init__(self):
        super().__init__('metrics_emitter')
        self.emitter = new Emitter(config_path=".resim/metrics/config.yaml")
        self.first_timestamp = None

        self.odom_subscriber = self.create_subscription(Odometry, '/odom', self.odom_callback, 10)

    def get_relative_timestamp(self, msg_time: Optional[MsgTime] = None) -> Optional[int]:
        if self.first_goal_received_time is None:
            return None

        current_time: Time
        if msg_time is not None:
            current_time = Time.from_msg(msg_time)
        else:
            current_time = self.get_clock().now()

        return current_time.nanoseconds - self.first_timestamp.nanoseconds

   def odom_callback(self, msg: Odometry):
     if self.first_timestamp == None:
      self.first_timestamp = Time.from_msg(msg.header.stamp).nanoseconds

       self.emitter.emit("odom_linear_velocity", {
        "x": msg.twist.twist.linear.x,
        "y": msg.twist.twist.linear.y,
        "z": msg.twist.twist.linear.z
       }, timestamp=self.get_relative_timestamp(msg.header.stamp))
Post-hoc Emissions
If you’re already recording log files from your simulations, you might want to take advantage of ReSim’s metrics builds. We can follow much the same pattern, but instead read the data from log files like MCAPs or rosbags. See a developed example below using ROS:
from resim.metrics.python.emissions import Emitter
from rosidl_runtime_py.utilities import get_message
import rosbag2_py
from pathlib import Path
import rclpy.serialization

def emit_velocity_data(emitter: Emitter, input_bag: Path):
    reader = rosbag2_py.SequentialReader()
    reader.open(
        rosbag2_py.StorageOptions(uri=str(input_bag), storage_id="mcap"),
        rosbag2_py.ConverterOptions(
            input_serialization_format="cdr", output_serialization_format="cdr"
        ),
    )

    # Create a dictionary mapping topic names to their types
    topic_type_map = {topic.name: topic.type for topic in reader.get_all_topics_and_types()}
    odom_topic = "/odom"

    if odom_topic not in topic_type_map:
        raise ValueError(f"topic {odom_topic} not in bag")

    msg_type = get_message(topic_type_map[odom_topic])

    while reader.has_next():
        topic, data, timestamp = reader.read_next()
        if topic == odom_topic:
             # Only emit if enough time has passed since last emission
              msg = rclpy.serialization.deserialize_message(data, msg_type)
              emitter.emit('odom_linear_velocity', {
                  'x': msg.twist.twist.linear.x,
                  'y': msg.twist.twist.linear.y,
                  'z': msg.twist.twist.linear.z,
              }, timestamp=timestamp)

if __name__ == "__main__":
    input_bag = Path("/tmp/resim/inputs/logs/record.mcap")
    with Emitter(config_path=".resim/metrics/config.yaml") as emitter:
        emit_velocity_data(emitter, Path(input_bag))
Series Emissions
If you’re emitting a series of data from a single call, there is an additional helper function - Emitter.emit_series. This will spread the data from this single emit call to multiple emission lines, to aid with query simplicity. For the initial example above, this can be written as:
emitter = new Emitter(config_path=".resim/metrics/config.resim.yaml")
emitter.emit_series("odom_linear_velocity", {
 "x": [1.0, 1.1, 1.1, 1.2],
 "y": [2.0, 1.9, 1.8, 1.7],
 "z": [3.0, 3.0, 3.0, 3.0]
}, timestamps=[0, 500000000, 1000000000, 1500000000])
# Equivalent to
emitter.emit("odom_linear_velocity", {"x": 1.0, "y": 2.0, "z": 3.0}, timestamp=0)
emitter.emit("odom_linear_velocity", {"x": 1.1, "y": 1.9, "z": 3.0}, timestamp=500000000)
emitter.emit("odom_linear_velocity", {"x": 1.1, "y": 1.8, "z": 3.0}, timestamp=1000000000)
emitter.emit("odom_linear_velocity", {"x": 1.2, "y": 1.7, "z": 3.0}, timestamp=1500000000)
The config file remains the same as the original example, as the resulting emissions match the existing definition of the topic. The function will validate the types of the data as it is emitted & ensure all series are of the same length.
Event Emissions
ReSim supports special types of emissions called “events”. These cause an event to be registered for your job at the given timestamp, which will appear in the Events tab in the ReSim app.
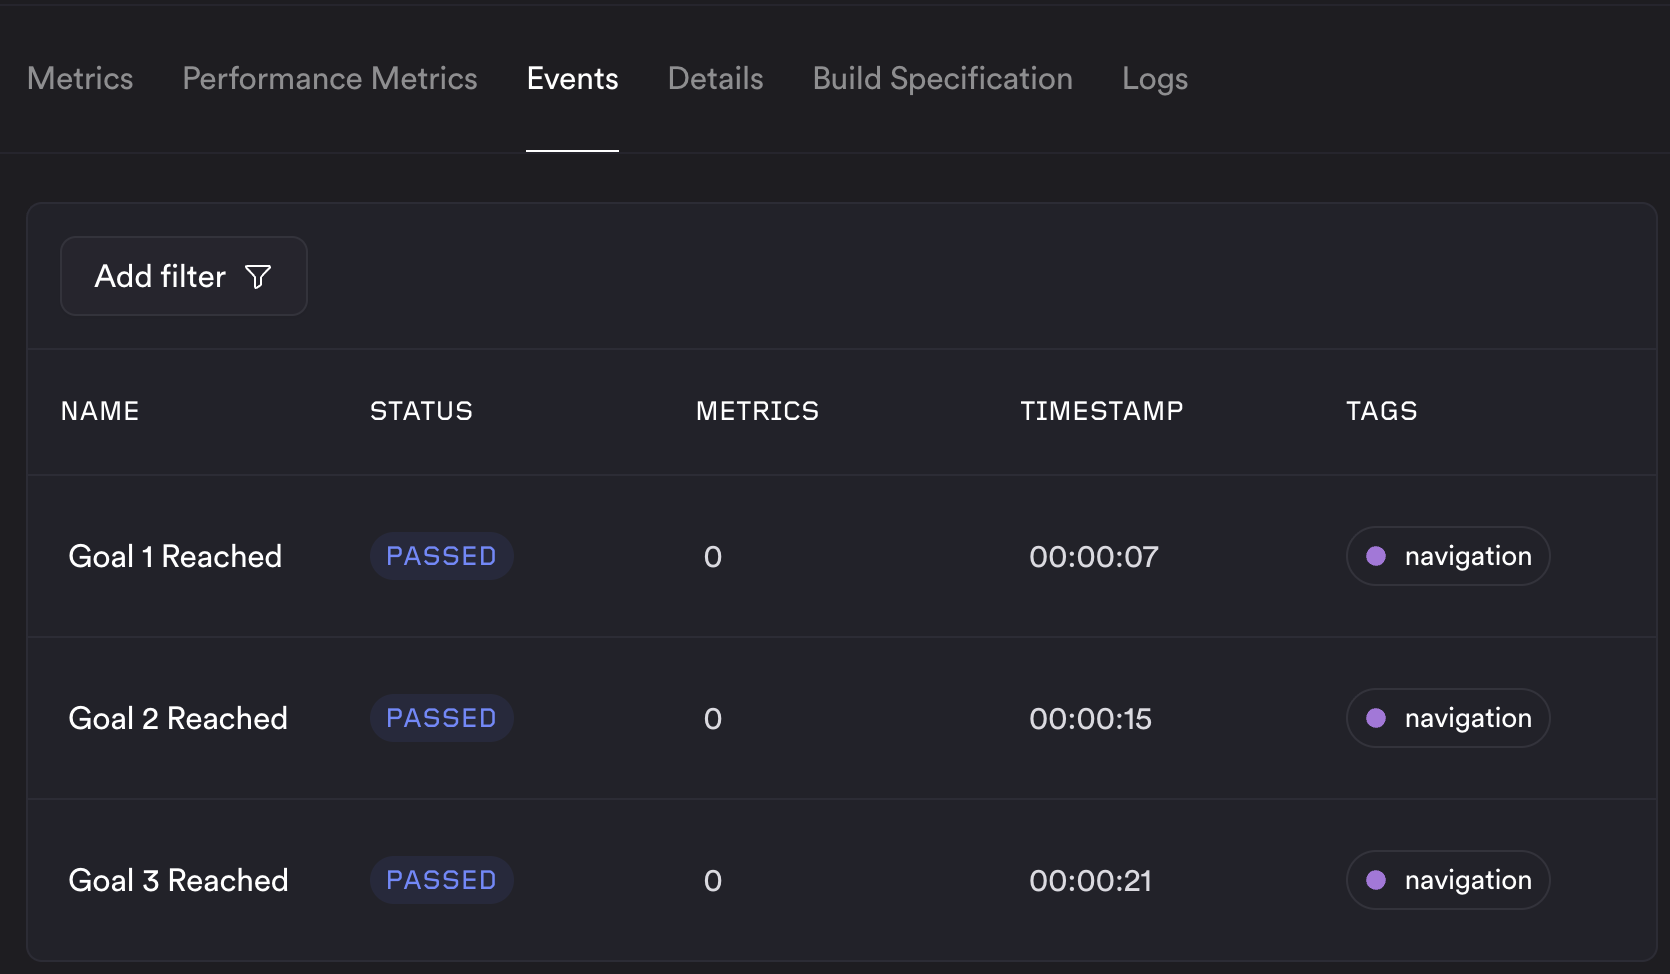
Each event refers to a specific point in time - such as reaching a goal, or when a system stop occurs. Metrics can be attached to each event by including them in the emission to help you understand the system state at that time. Events are emitted using the emitter.emit_event method - see the example below:
topics:
 # ...
 goal_reached:
    event: true
    schema:
      name: string
      description: string
      status: status
      tags: string[]
      metrics: metric[]
emitter = new Emitter(config_path=".resim/metrics/config.resim.yaml")
emitter.emit_event({
 name: "Goal 1 Reached",
 description: "Robot successfully reached goal number 1",
 status: "PASSED",
 tags: ["navigation"],
 metrics: [{
  "name": "Stereo View",
  "type": "image",
  "value": ["goal_1.png"]
  "status": "PASSED"
 }]
}, event=True, timestamp=1750000000)
The structure of the metric[] object is defined as
"metrics": [
 {
     "name": "string",
     "description": "optional",
     "status": "optional. PASSED | FAIL_BLOCK | etc."
     "type": "scalar | image | plotly | text",
     "value": "the value of the metric. Changes based on the type.",
     // examples:

     // Scalar and text metrics are treated the same way.
     // "type": "scalar" | "text",
     // "value": "2.37",

     // "type": "image",
     // "value": ["1.jpg", "2.jpg"]

     // "type": "plotly"
     // "value": "{ a valid plotly blob}", ie. the output of fig.to_json()
  }
]
Custom emissions API
If Python isn’t your jam, you’re more than welcome to write your own emitter in the language of your choice. The minimal implementation of the emit API (without validation) in Python is here. If you’d like official support for your language of choice, please reach out to our ProServe team and we’ll look into it!
Metrics development
Adding your first metric
We recommend developing your first couple of metrics using debug dashboards. The first step is to create an empty metrics set at the end of your config file:
...
metrics sets:
  My Metrics:
    metrics: []
Next, create the debug dashboard using the ReSim CLI - see the linked docs for installation instructions. Once you've generated an emissions file, it can be ingested using the resim metrics debug command, invoked like so:
resim metrics debug --project "metrics-demo" --emissions-file "emissions.resim.jsonl" --metrics-config-path ".resim/metrics/config.resim.yaml" --metrics-set "My Metrics"
After a short time, this will print a URL to the debug dashboard which is linked to the config and emissions file provided. From here, you can start to develop your metrics. See the video below for a demonstration.
Once you're happy with your metrics, you can export the current state of the dashboard by clicking the "Export Config" button. This will download a zip file containing the config file and any custom templates configured. You can then replace your local config file with this - you may need to do some formatting & reordering to get it how you like it.
You can also develop your metrics in the config file directly, and then reusing resim metrics debug to test them. See the metric templates below for more details. Once you've added a metric in the config file, make sure that it's included in your metrics set:
...
metrics:
  Robot Speed:
    type: test
    description: Robot speed over time
    query_string: |
      SELECT
        'Speed',
        timestamp / 1E9 AS "Time (s)",
        SQRT(POWER(x, 2) + POWER(y, 2)) AS "Speed (m/s)"
      FROM odom_linear_velocity;
    template_type: system
    template: line

metrics sets:
  My Metrics:
    metrics:
      - Robot Speed
And then you can view it in the debug dashboard by running:
resim metrics debug --project "metrics-demo" --emissions-file "emissions.resim.jsonl" --metrics-config-path ".resim/metrics/config.resim.yaml" --metrics-set "My Metrics"
Image Metrics
At this time, image metrics are not supported in the debug dashboard as they have a more complex ingestion process. Comment them out in your config in development, and add them back in when you're ready to test them with a real batch.
Status checks
You can make a metric affect pass/fail by adding a status block. Status checks run a separate query that is evaluated against threshold values: if the query returns any rows, the metric is marked as blocking (or warning).
Under status you configure:
query_string— A SQL query with exactly one?parameter. The?is replaced with theblockorwarnthreshold value when the check runs (e.g.HAVING COUNT(*) < ?orWHERE value > ?).block— Threshold value for a blocking failure. If the status query returns any rows when run with this value, the job is marked as failed (blocker).warn— Optional. Threshold value for a warning. If the query returns any rows when run with this value, the metric is marked as a warning instead of a pass.
Example: require at least 3 goals to be reached; otherwise the metric blocks. The status query returns a row when the count is below the threshold, so we use HAVING COUNT(*) < ? with block: 3:
Time to reach final goal:
  type: test
  description: Time between receiving first goal and reaching final goal. Blocks if less than 3 goals are reached.
  query_string: |
    SELECT
      CASE
        WHEN (SELECT COUNT(*) FROM time_to_goal) != 3 THEN 75.0
        ELSE sum(time_s)
      END
    FROM time_to_goal;
  template_type: system
  template: scalar
  status:
    query_string: SELECT '1' FROM time_to_goal HAVING COUNT(*) < ?
    block: 3
Running your first Metrics 2.0 batch
Once you’re happy with your metrics set, you can give your stack its first run in ReSim. First step is to register your config with the ReSim platform:
$ resim metrics sync --project "metrics-demo" --branch "metrics-setup"
If you have a test suite you want to run your metrics set against, you can update the test suite as so:
$ resim suite revise \
  --project "metrics-demo" \
  --test-suite "Nightly Suite" \
  --metrics-set "My Metrics"
# Now run the test suite:
$ resim suite run \
  --project "metrics-demo" \
  --test-suite "Nightly Suite" \
  --build-id "dc71ebee-1601-4d98-aab4-d4bdecfafca1"
If running a batch directly, the parameters are similar:
$ resim batches create --project "metrics-demo" --metrics-set "My Metrics" ...
Note: Each branch in your project has its own copy of the config file, which might result in lots of CLI calls to re-register config files. To help with this, at the time of triggering a batch your config can automatically be synced to your branch with the --sync-metrics-config flag:
$ resim suite run --project "metrics-demo" \
  --test-suite "Nightly Suite" \
  --build-id "dc71ebee-1601-4d98-aab4-d4bdecfafca1" \
  --sync-metrics-config
With that, your batch should be running. Wait for it to complete, and the metrics you have configured will be shown automatically in the ReSim app. If you want to make more changes, you can simply repeat the process of exporting the config and replacing your local config file.
Changing your metrics
If you make changes to your metrics on a completed batch, the changes will be saved for the instance of metrics you are currently viewing. For example, if you make a change to the metrics for a single job, it will not be reflected on other jobs in the batch or going forward until you synchronise the config file manually.
Authoring batch metrics
When defining a metric in the config file, you may have spotted the type: test definition. This helps our metrics system determine where that metric should be displayed - in this case, it will be shown as a test result. The other option is type: batch, which will be shown as a batch metric - which are used for creating aggregate metrics across an entire batch. This changes the data which is available to the metric when authoring the query. This allows really easy authoring of high level metrics - such as "What was the average speed of the robot across all jobs in the batch?" which can be defined as:
Average Speed:
  type: batch
  description: Average speed of the robot across all jobs in the batch.
  query_string: SELECT AVG(speed) FROM robot_speed
  template_type: system
  template: scalar
Dashboards
Work in Progress
Dashboards are a work in progress. These docs will be added soon!
Metric Templates
Each metric uses a template that defines how its query results are rendered. The following system templates are available; in all cases the query runs against your emitted topic data, and column order (and for charts, column aliases) determine layout and axis titles.
Line Chart
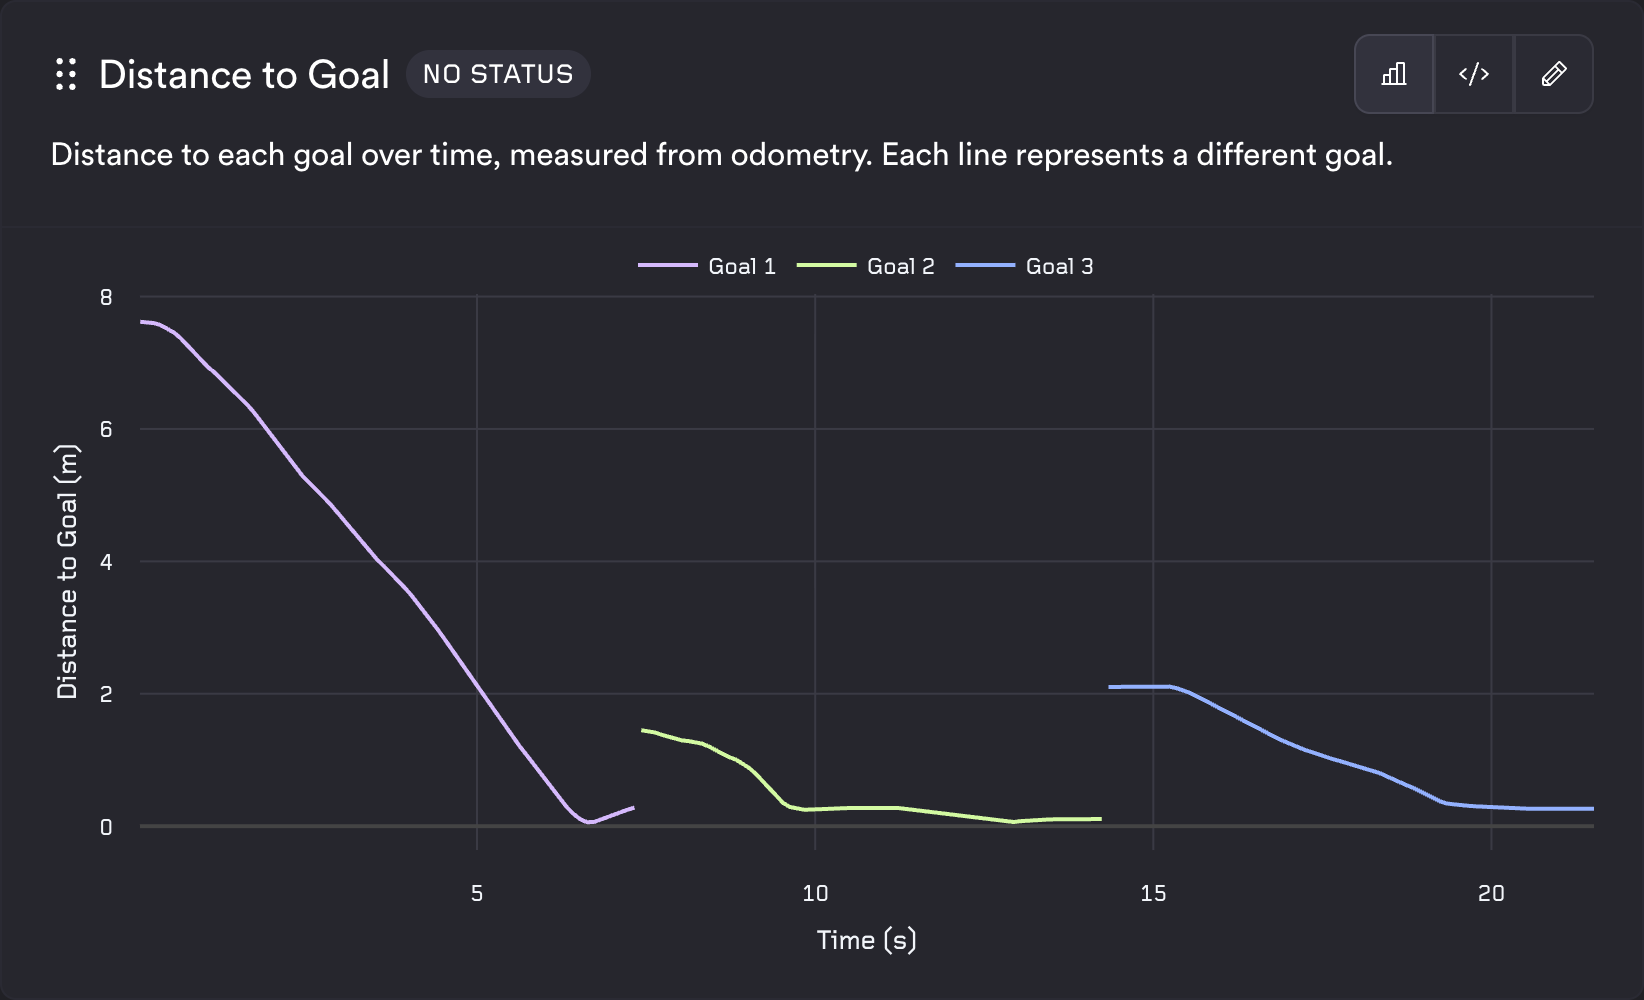
The line template expects exactly three columns in order: a series identifier, then the x value, then the y value. Each row is [series_name, x_value, y_value]. Different series_name values produce multiple series on the same chart. The axis titles are taken from the column names at positions 2 and 3, so use descriptive aliases with units (e.g. "Time (s)", "Speed (m/s)"). Emitted timestamps are in nanoseconds; divide by 1E9 to show seconds.
Example config:
Distance to Goal:
  type: test
  description: Distance to each goal over time, measured from odometry. Each line represents a different goal.
  query_string: |
    SELECT
      goal_name as group_name,
      timestamp / 1E9 AS "Time (s)",
      distance_m as "Distance to Goal (m)"
    FROM goal_distance;
  template_type: system
  template: line
Bar Chart
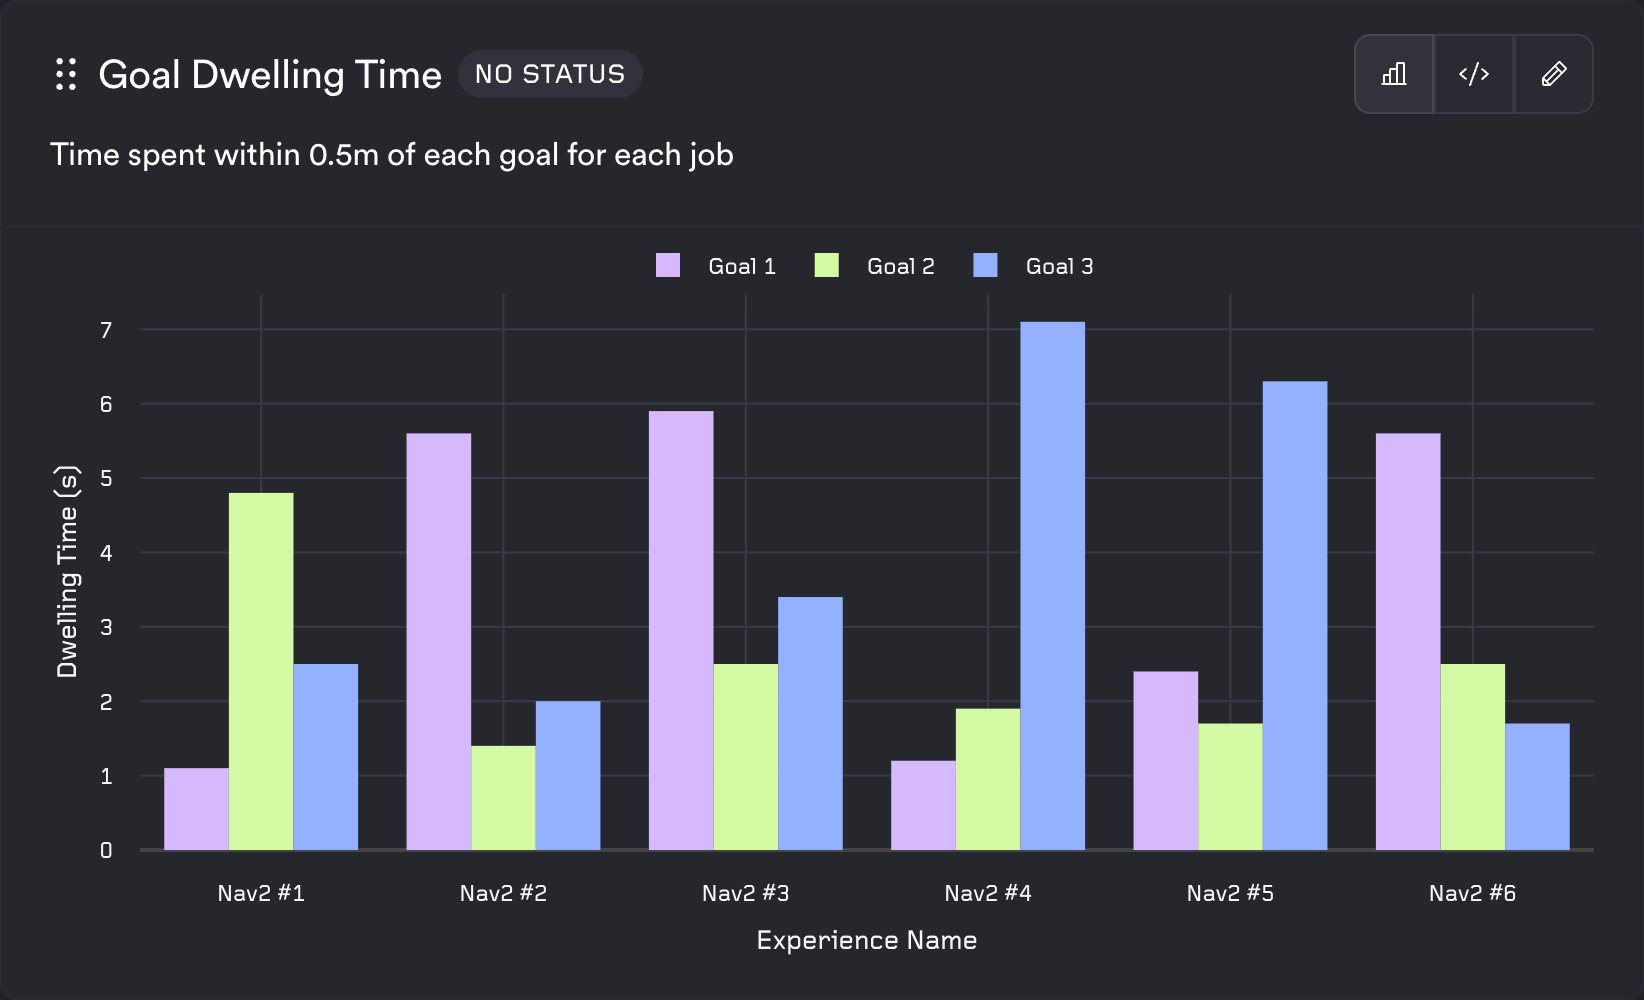
The bar template uses the same shape as the line template: three columns [series, x, y] and rows [series_name, x_value, y_value]. It is well suited to aggregated or categorical comparisons (e.g. per experience, per goal).
Example config:
Maximum Localization Error:
  type: batch
  description: Maximum position difference between odometry and AMCL localization across all experiences.
  query_string: |
    SELECT
      'Maximum',
      m.experience_name as "Experience Name",
      MAX(position_diff_m) as "Maximum Localization Error (m)"
    FROM pose_difference pd
    JOIN metadata m on pd.job_id = m.job_id
    GROUP BY m.experience_name ORDER BY m.experience_name;
  template_type: system
  template: bar
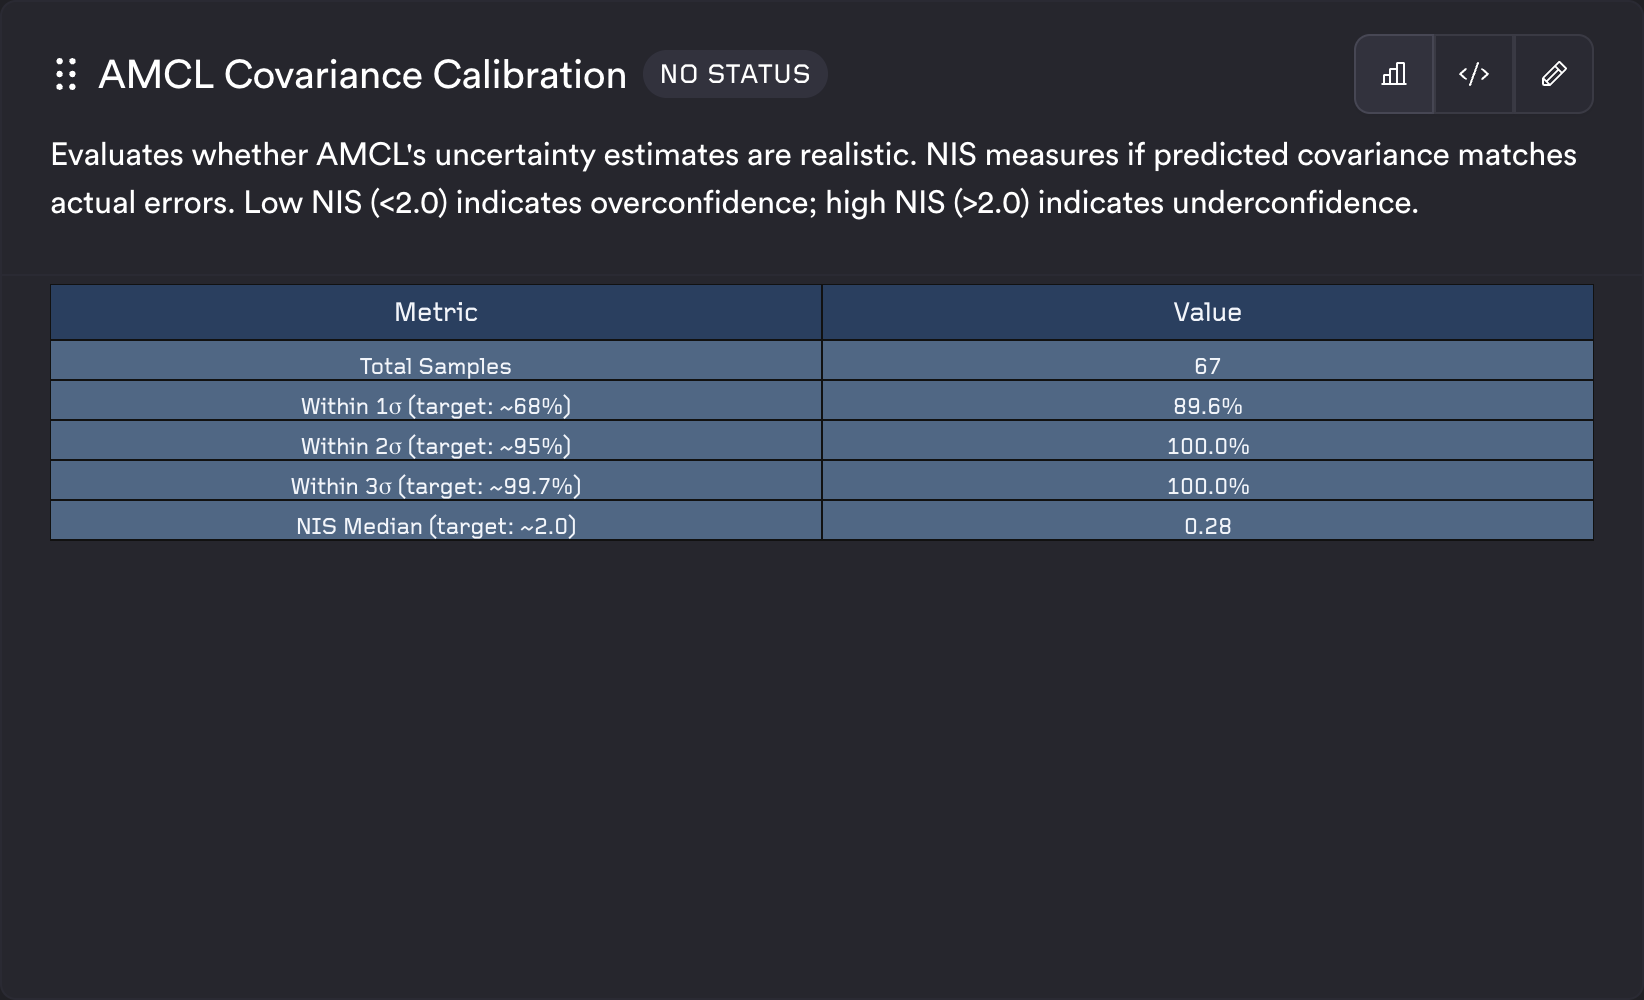
Table
The table template accepts any number of columns and any number of rows. Column names become the table headers and each row is rendered as a table row. Use it for summary statistics, key-value pairs, or any tabular output.
Example config:
AMCL Covariance Calibration:
  type: test
  description: Evaluates whether AMCL's uncertainty estimates are realistic.
  query_string: |
    SELECT "Metric", "Value" FROM (
      SELECT 1 as sort_order, 'Total Samples' as "Metric", CAST(COUNT(*) AS VARCHAR) as "Value"
      FROM covariance_accuracy
      UNION ALL
      SELECT 2 as sort_order, 'Within 1σ (target: ~68%)' as "Metric", CONCAT(CAST(ROUND(100.0 * AVG(CASE WHEN within_1_sigma = 1 THEN 1.0 ELSE 0.0 END), 1) AS VARCHAR), '%') as "Value"
      FROM covariance_accuracy
      ORDER BY sort_order
    );
  template_type: system
  template: table
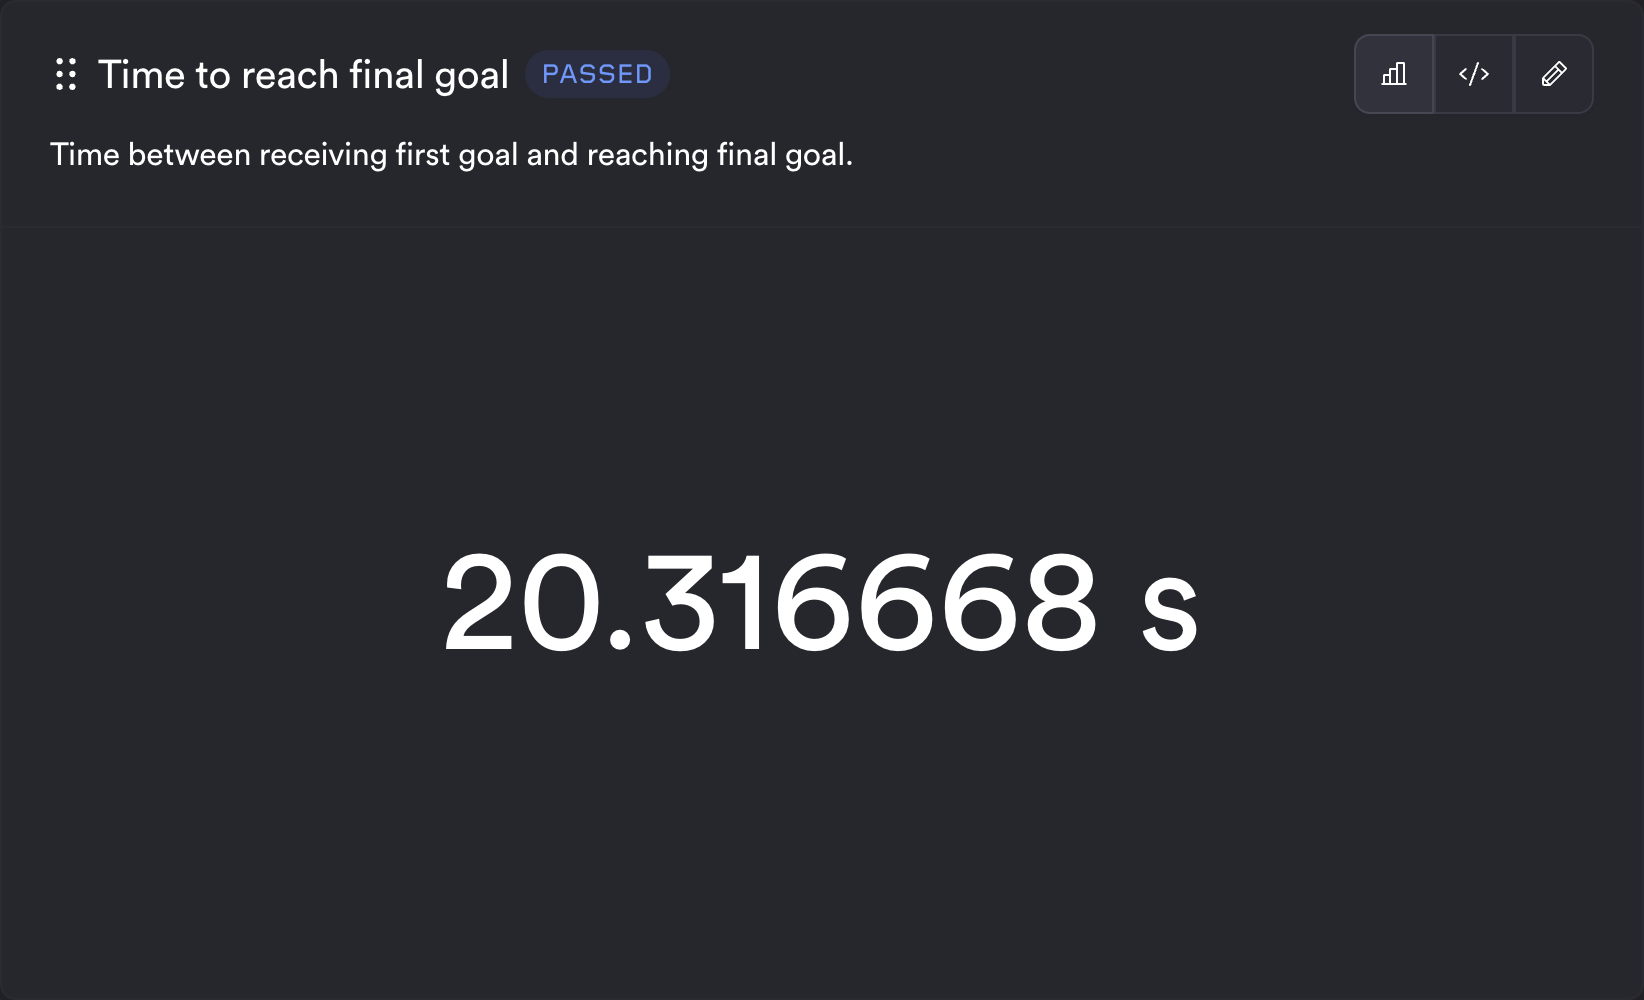
Scalar
The scalar template expects the query to return a single value. The renderer uses the first row and first column. Optional status thresholds can block or warn based on a separate query (e.g. checking that a count meets a minimum). You can also provide units, which will be displayed after the value.
Example config:
Time to reach final goal:
  type: test
  description: Time between receiving first goal and reaching final goal.
  query_string: |
    SELECT
      CASE
        WHEN (SELECT COUNT(*) FROM time_to_goal) != 3 THEN 75.0
        ELSE sum(time_s)
      END
    FROM time_to_goal;
  template_type: system
  template: scalar
  units: "s"
  status:
    query_string: SELECT '1' FROM time_to_goal HAVING COUNT(*) < ?
    block: 3
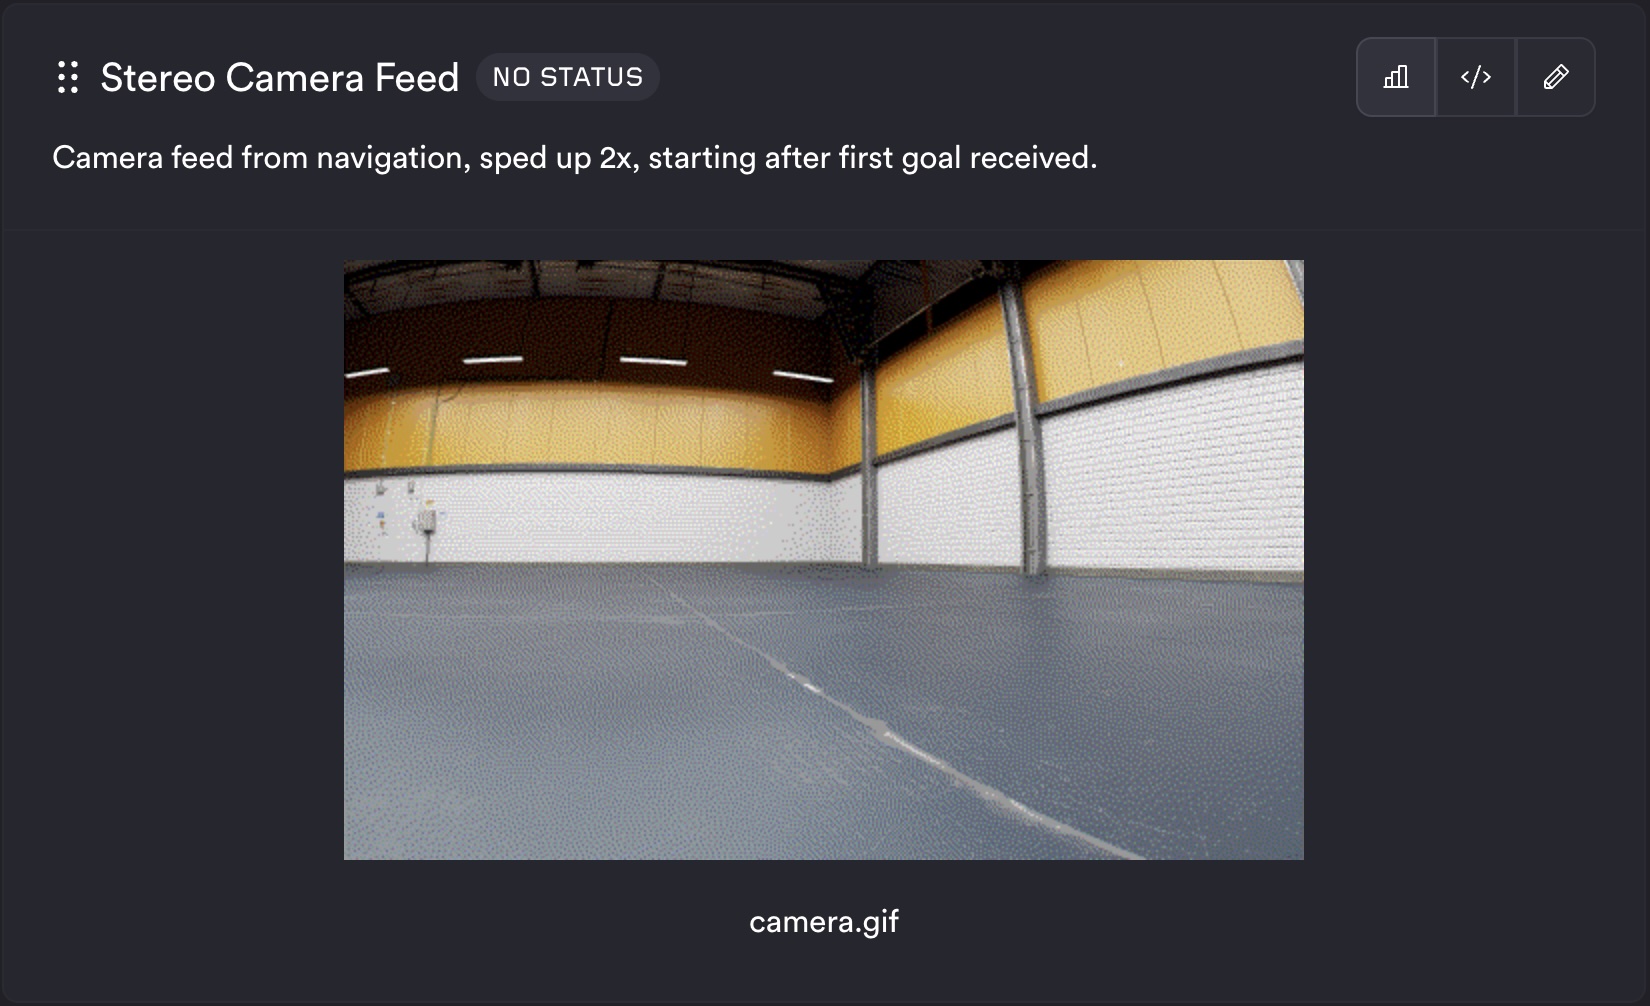
Image
The image template expects one column whose values are image identifiers (e.g. filenames or paths) available in the job logs. Each row produces one image in the metric output.
Example config:
Stereo Camera Feed:
  type: test
  description: Camera feed from navigation, sped up 2x, starting after first goal received.
  query_string: SELECT filename FROM camera_gif
  template_type: system
  template: image
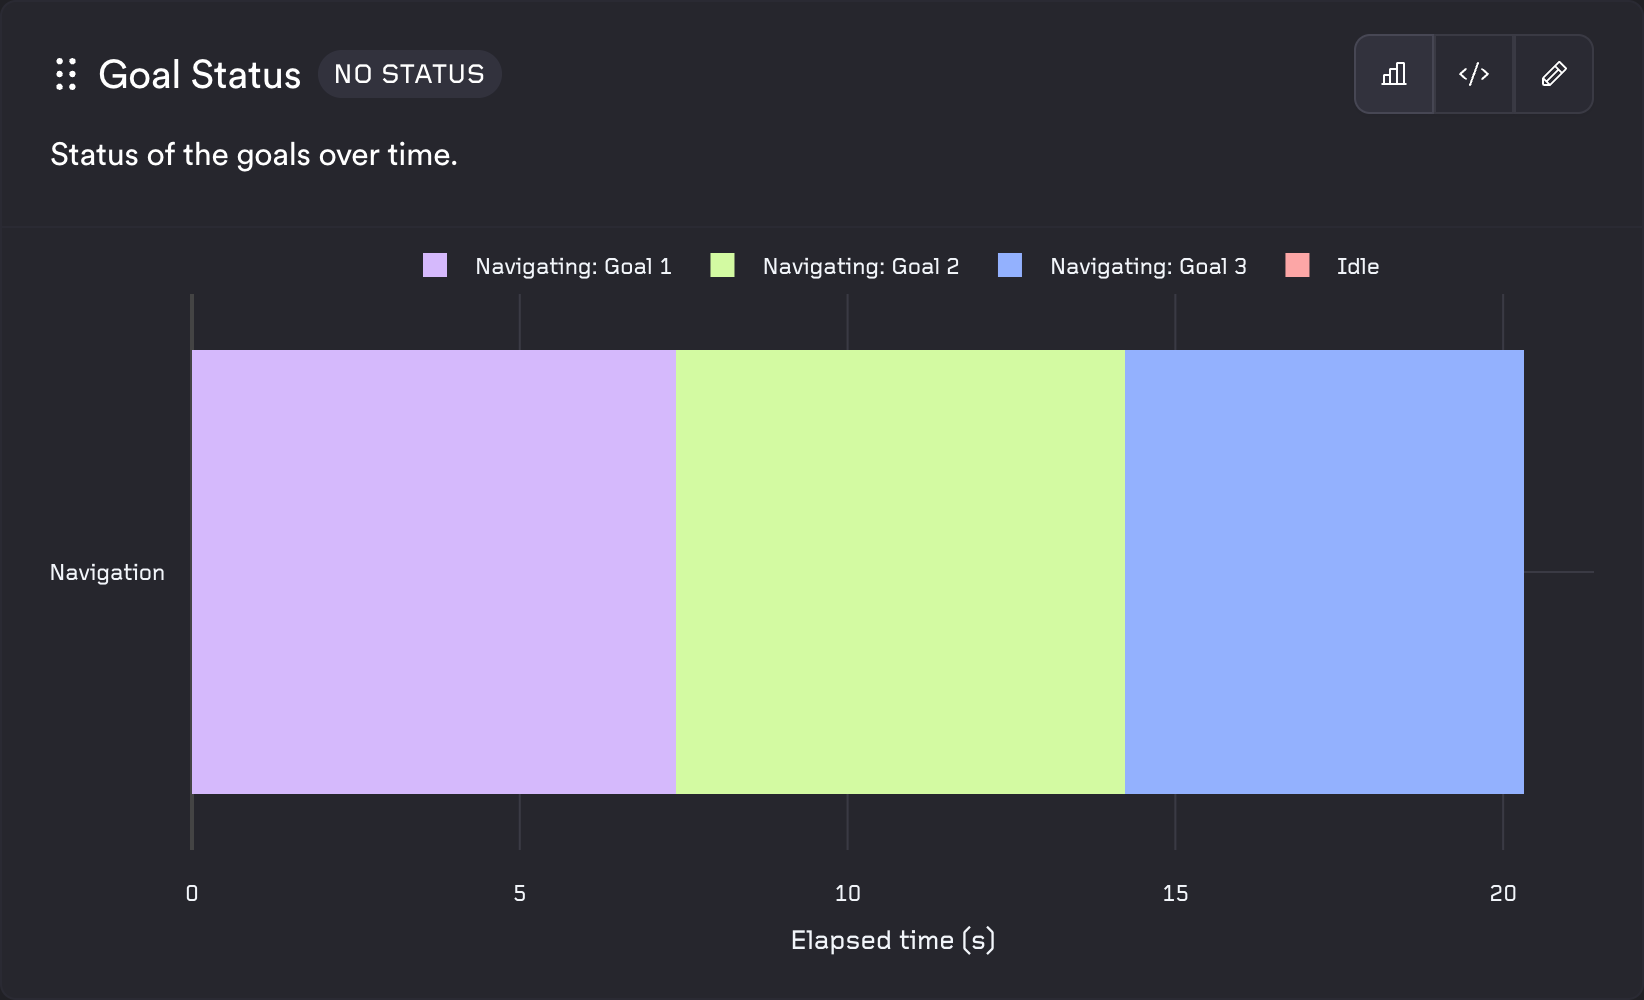
State Timeline
The state timeline template shows discrete states over time for one or more systems. The query must return exactly three columns in order: system identifier, timestamp, and state name. Each row is [system_name, timestamp, state_name]. Use different system_name values to show multiple systems. Consecutive rows with the same state are merged into segments. Timestamps are in nanoseconds and are converted to elapsed seconds from the first timestamp for the x-axis; the x-axis title is "Elapsed time (s)" and the y-axis title comes from the alias you give the system column. Each unique state is assigned a color from the ReSim palette.
Example config:
Goal Status:
  type: test
  description: Status of the goals over time.
  query_string: |
    SELECT
      'Navigation' as "System",
      timestamp,
      state
    FROM goal_status;
  template_type: system
  template: state_timeline
Custom templates
Work in Progress
Custom template docs will be added soon! If you need support, reach out the ReSim team.
Metadata Schema
When you SELECT * on your topics, you will notice some additional metadata such as batch_id and job_id are returned. These can be used to join against a special metadata table which contains information about your build, experience, and more. The metadata table has one row per job in the batch. Batch metrics (type: batch) query across all rows. This allows you to, in something like a batch metric, compute
- what was the min, average, and max speed, for each experience in my test set?
- how did the performance of this metric vary across sunny, cloudy, and rainy test scenarios?
An example batch metric:
“How does the min, avg, and max speed vary across each experience?”
SELECT m.experience_name, MIN(speed), AVG(speed), MAX(speed)
FROM drone_speed d
JOIN metadata m on d.job_id = m.job_id
GROUP BY m.experience_name;
If you want to see all metadata available you can run this query:
SELECT * FROM metadata
Column reference
| Column | Type | Description / Observed values |
|---|---|---|
org_id |
string | Organisation identifier, e.g. "resim.ai" |
batch_id |
string (UUID) | ID of the batch this job belongs to |
job_id |
string (UUID) | Unique identifier for the individual job |
project_id |
string (UUID) | ReSim project ID |
branch_id |
string (UUID) | Branch ID within the project |
branch_name |
string | Human-readable branch name, e.g. "main" |
build_id |
string (UUID) | ID of the build under test |
build_name |
string | Human-readable build name |
build_creation_timestamp |
timestamp | When the build was created |
experience_id |
string (UUID) | ID of the experience (scenario) for this job |
experience_name |
string | Human-readable experience name |
experience_tag_ids |
string[] | UUIDs of the experience tags attached to this job |
experience_tag_names |
string[] | Names of the experience tags attached to this job |
test_suite_id |
string (UUID) | ID of the test suite |
test_suite_name |
string | Human-readable test suite name |
test_suite_revision |
int | Revision number of the test suite |
job_status |
string | Raw execution status — e.g.: 'SUCCEEDED', 'FAILED' |
job_metrics_status |
string | Metrics evaluation status — e.g. 'PASSED', 'FAILED' |
job_conflated_status |
string | Combined status used for pass/fail decisions — e.g.: 'PASSED', 'ERROR', 'BLOCKER', 'WARNING' |
custom_field_keys |
string[] | Custom field names set on the job (may be []) |
custom_field_values |
string[] | Custom field values, parallel to custom_field_keys (may be []) |
time |
timestamp | When the relevant job started |
Array column usage
experience_tag_names and experience_tag_ids are Trino arrays. Common patterns:
-- Check membership
WHERE contains(experience_tag_names, 'my_tag')

-- Filter to tags matching a prefix, take the first result (1-based indexing)
filter(experience_tag_names, x -> starts_with(x, 'my_prefix_'))[1]

-- Conditional count across jobs
count_if(job_conflated_status = 'PASSED')

-- Group jobs by a tag prefix
WITH classified AS (
  SELECT
    filter(experience_tag_names, x -> starts_with(x, 'my_prefix_'))[1] AS group_name,
    job_conflated_status
  FROM metadata
  WHERE contains(experience_tag_names, 'my_tag')
)
SELECT group_name, count_if(job_conflated_status = 'PASSED') AS passed
FROM classified
WHERE group_name IS NOT NULL
GROUP BY group_name